
Summary
Four main types:
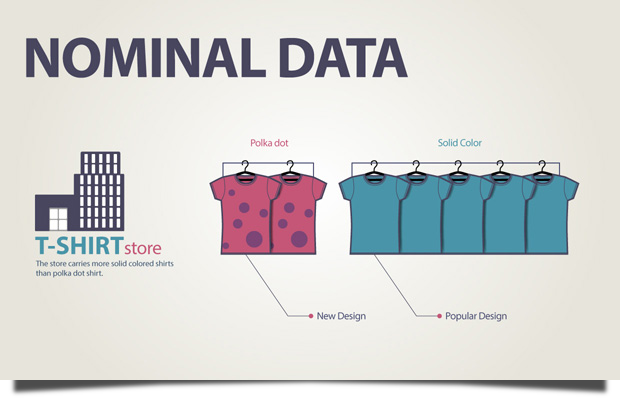
Norminal – Organising data into named categories and unordered. Counted and made into sense but can’t be counted or calculated the average category of your basket.
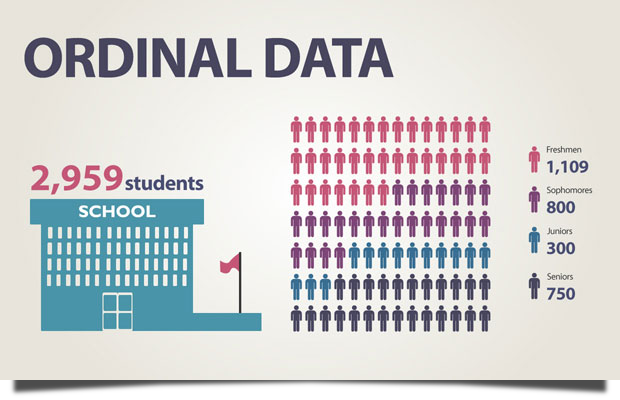
Ordinal – Short, medium and long lines. Collecting data with order such as numbers or people in lines. Count and used for mathematical sense. Averages can be counted for calculations and made sense of.
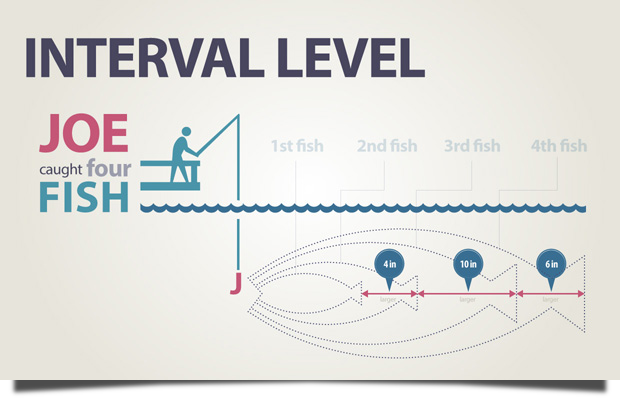
Interval – Values of measurement such as time, calendars and temperature.
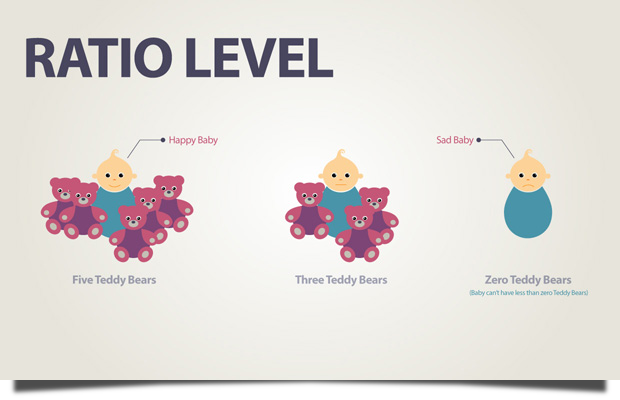
Ratio – Data does have a meaningful 0 point. You don’t have to have categories from that type. Height, weight, time and money.
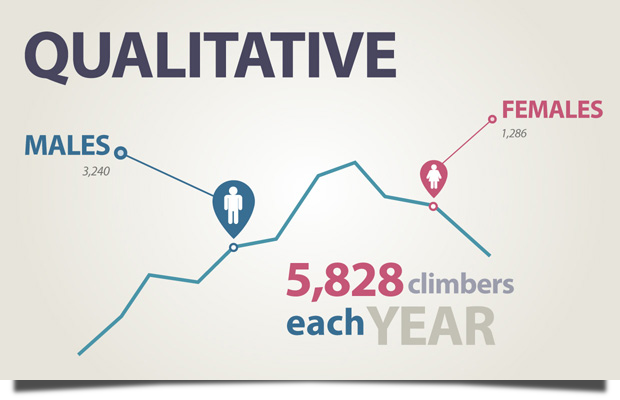
Qualitative – recording or videos of interviews.
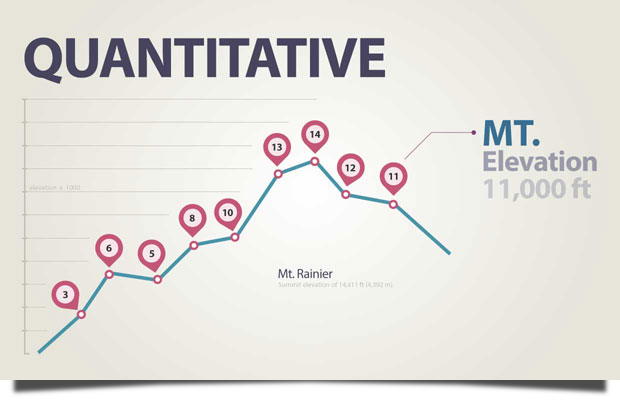
Quantitative – can be counted and made into percentages.
Important Aspect & Why
Us as designers need to understand the types of data we use so we can design data visualisations correctly so putting names on categories can help us with this.
Image References
Data. [Image] (2016). Retrieved 1st August 2016 from http://lc.gcumedia.com/hlt362v/the-visual-learner/images/data.png
Norminal. [Image] (2016). Retrieved 1st August 2016 from http://lc.gcumedia.com/hlt362v/the-visual-learner/images/nominal-data.png
Ordinal. [Image] (2016). Retrieved 1st August 2016 from http://lc.gcumedia.com/hlt362v/the-visual-learner/images/ordinal-data.png
Interval. [Image] (2016). Retrieved 1st August 2016 from http://lc.gcumedia.com/hlt362v/the-visual-learner/images/interval-level.png
Ratio. [Image] (2016). Retrieved 1st August 2016 from http://lc.gcumedia.com/hlt362v/the-visual-learner/images/ratio-level.png
Qualitative. [Image] (2016). Retrieved 1st August 2016 from http://lc.gcumedia.com/hlt362v/the-visual-learner/images/qualitative.png
Quantitative. [Image] (2016). Retrieved 1st August 2016 from http://lc.gcumedia.com/hlt362v/the-visual-learner/images/quantitative.png
