Summary
We are all suffering from information overload and there might be an easy solution to this. Using our eyes more. Visualising the data and designing the data that is important. By visualising data you can turn it into a landscape or a map to see with your eyes. When you’re lost in information, an information map is useful. Data is the new oil, it is a resource that we can shape to find new insights as it is all around us. It is not a great metaphor, so if we were to change it to data is the new soil, as it is a fertile creative medium. We irrigate large amounts of data with creativity and its been worked by unpaid government workers as its a fertile medium. Visualisations feel as if they are flowers, blooming from this medium. If you work with it in a way, different patterns and meanings can be told from the data. If you ask the right question, interesting things can emerge. If you combine the language of the eye, with the language of the mind it is more than just words, numbers and concepts, you then start to speak two languages, each enhancing the other. We can use this new language to alter our views. To be fair, we need to compare similar data sets to see a fuller picture that can lead to us changing our perspective. Visualisations are a form of knowledge compression, squeezing as much information into a small space. Visualisations can also be a form of ideas and concepts, so we can see what others thinking and where they are coming from.


Important Aspect & Why
As designers, we need to understand that design is about solving problems and producing solutions. Information design is about solving information problems as have a lot of information in our society from the overload, trust and reliability and lack of transparency. We need to create information that has a magnetic quality so it draws the viewers in.
Image References
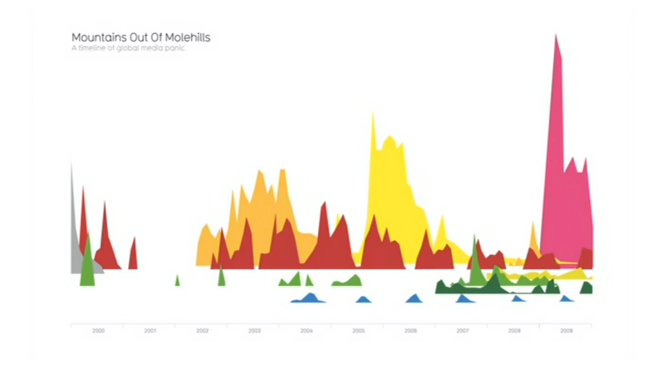
Mountains out of molehills. [Image] (2010). Retrieved 17th October 2016 from http://www.informationisbeautiful.net/visualizations/mountains-out-of-molehills/
Data is the new soil. [Image] (2010). Retrieved 17thOctober 2016 from http://www.ted.com/talks/david_mccandless_the_beauty_of_data_visualization#t-401680
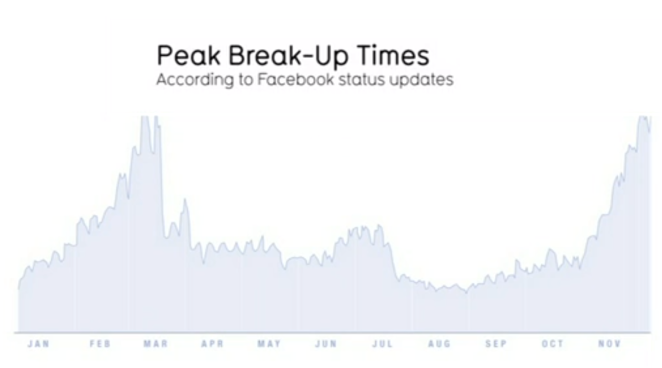
Peak break up times. [Image] (2010). Retrieved 17th October 2016 from http://www.ted.com/talks/david_mccandless_the_beauty_of_data_visualization#t-401680
